I have undertaken to do some (mostly statistical) analysis of the recently leaked Afghan War Diary. In this post I will describe some of the earliest results of my analysis. this will serve mostly as proof of principle for my code.
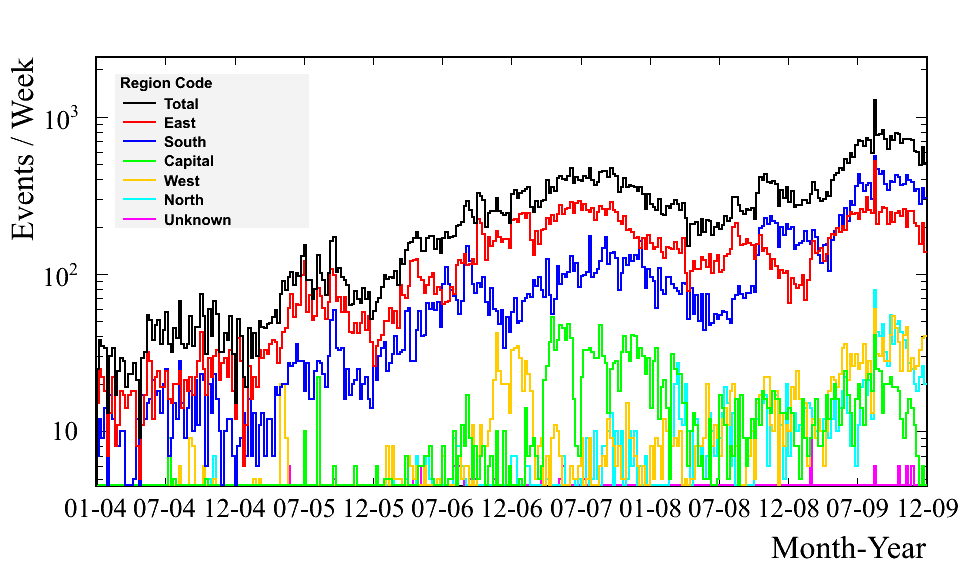
This plot shows a histogram of the number of events per week. The total events are plotted in black and the color designation is that as given in the field "Region." we can immediately see that the East and South generate (nearly) and order of magnitude more reports (events) than the other regions (combined).
I am very open to ideas, hints and sharing of results, so please contact me!
Does anyone know what happened near 08-09 that might have caused the large spike in events?
ZNetwork is funded solely through the generosity of its readers.
Donate