 There is little doubt Obama inherited the recent economic crisis from his predecessors. George W. Bush left a toxic economic legacy unequaled since the days of Herbert Hoover in 1932: a $27 trillion rise in total U.S. debt; a doubling of the federal debt from $5 trillion to more than $9 trillion; a depression in housing and construction; a collapse of the banking system in September 2008; more than $4 trillion in tax cuts favoring investors, speculators, and corporations; a breakdown in health-care and retirement systems financing; an accelerating unequal distribution of incomes benefiting the wealthiest 1 percent households at the expense of the bottom 80 percent; wars costing more than $3 trillion on his watch; trade deficits approaching $1 trillion annually; and, as he left office, a veritable collapse of business investment and consumer spending which quickly resulted in job losses of roughly a million a month for six months between October 2008 and March 2009—a job loss rate faster than that which occurred in 1929-30. While it is true that Obama cannot be blamed for causing the current economic crisis, the failure of recovery to date is clearly Obama's and is the economic hallmark of his first two years in office.
Obama and his advisors proclaim their policies prevented an even greater collapse of the system, that there almost certainly would have been another great depression on the scale of the 1930s if they hadn't bailed out the banks, rescued auto companies and other industries at taxpayer expense, spent $812 billion on a stimulus program, passed a financial regulation bill, and so forth. But what has the more than $6 trillion disbursed by the Obama administration actually produced in terms of economic recovery for all?
What's A Recovery?
It is important to be clear what recovery means. It does not mean having prevented a depression. It does not mean having stopped the banks from further collapse. And it certainly does not mean a return to pre-crisis levels of bank and corporate profits. All of that has, indeed, occurred. The big 19 financial institutions that control two-thirds of all the assets in the U.S. financial system have been stabilized—even though some, like Citigroup and AIG, are still technically insolvent. They have been rescued—as have GM and Chrysler, their financial arms, finance companies, mutual funds, countless mortgage lenders, and other institutional investors. Meanwhile, more than 200 smaller, regional U.S. banks have been closed by the FDIC, with another 829 on the FDIC's potential failure list—a number doubling over last year and growing each month. At the same time, the big 19 banks over the past year have accumulated and are sitting on more than $1 trillion in cash and liquid assets, which they refuse to loan to small and medium businesses to prevent further layoffs, but eagerly loan to traders (professional speculators) globally to finance quick capital gains in Chinese properties, Brazilian currency, short selling of Greek bonds, gold futures, and emerging market funds. Similarly, the non-financial S&P 500 corporations and other multinational corporations over the past year have accumulated an even larger cash hoard of $1.84 trillion, according to the Financial Times—which they refuse to invest in the U.S. to create jobs.
At minimum, recovery can only mean a return to levels of employment, residential and commercial construction, industrial production, retail sales, business and consumer spending, credit availability and lending, and other key economic indicators that predated the beginning of the economic descent that began in the second half of 2007. To say, as the Obama administration has, that recovery means conditions are not getting worse is to redefine recovery.
From the beginning, in February 2009, the Administration impaled itself on the horns of an economic dilemma. One horn has been the failure to recover jobs. The other has been the failure to staunch the depression-level economic bloodletting in residential housing and commercial property. Here recovery is, in fact, continuing to decline. In all other cases of economic indicators over the past 18 months, recovery has meant a recouping of less than half of what was lost, followed by stagnation or, even worse, a return to decline.
Dimensions Of The Jobs Crisis
What has been the Obama record to date on jobs—which have not only failed to recover by any measure but in fact have continued to deteriorate? Most accounts of the jobs situation focus on what is called the U.S. Labor Department's U-3 unemployment indicator. This is a very limited, conservative assessment of job loss, however. More accurate is the broader U-6 measure. Both measures have risen significantly since Obama came into office in January 2009: the U-3 from 7.2 to 9.5 percent and the U-6 from 12.6 to 17.1 percent. Most of that rise in unemployment occurred in the first seven months. Unemployment levels then stagnated and remained at 9.5 and 17.1 percent from July 2009 to September 2010.
It is worth noting that Obama's $812 billion stimulus appears to have had virtually no effect on reducing the unemployment rate from mid-2009 to late summer 2010. That is why the Administration has fallen back to the position that the stimulus at least prevented unemployment from getting worse. The stimulus has not created any jobs, although it certainly helped prevent the 25 million still unemployed (per the U-6 measure) from starving and not paying the rent, for which it should be commended. But that's still not job creation.
But what about the additional two million jobs that were lost from July 2009 to September 2010, after the stimulus? Nonfarm jobs continued to fall and 2.65 million more workers left the labor force, at least half of whom were previously employed and just gave up on finding work. And a million more workers were converted from full time to part time or hired as part time in just the last two months from July 2010 to September 2010. That's a total of at least two million more without work during the period in which the stimulus bill was supposed to be having its positive effect on employment.
 Yet another perspective on the jobs situation is to consider severity of unemployment. Looking at those suffering from 27 weeks or more of unemployment—i.e., the long-term unemployed—the picture has been getting worse as well over the past year. In January 2009, there were 2.6 million people (23 percent of the unemployed) who were jobless more than 27 weeks. By July 2009, this had risen to 4.9 million or 34 percent. By July 2010, the numbers rose to 6.5 million and 45 percent. Nevertheless, Congress cut off insurance benefits for these long-term unemployed despite their rising numbers. Not surprisingly, most gave up and left the labor force, thereby providing a false impression unemployment rates were stabilizing.
Still another way to look at the growing seriousness of the jobless situation is to consider what is called the JOLTS indicator. This measures how many jobless there are for each available job opening. When Obama came into office it was three unemployed workers for every available job opening. Today that number is approximately five to one.
An indicator of the future direction of jobs is the weekly jobless claims estimate. Workers who apply for new jobless benefits are a partial indicator of future unemployment. Weekly jobless claims less than 400,000 is correlated with positive jobs growth. Claims above 400,000 means jobs are continuing to be lost. When Obama entered office the jobless claims were averaging 600,000 a week. This slowed to around 500,000 a week by the fall of 2009. But a year later, by September 2010, new jobless claims were still averaging 465,000 a week.
A look at what has happened on the jobs front from January of this year through July is also revealing. The Administration trumpeted the fact that the private sector has created 593,000 jobs since January. But less often mentioned is the fact that at least 300,000 of these are temporary hires. The federal government had hired 575,000 jobs by April. But 574,000 of these were temporary census workers, the majority of whom have since been laid off. So far as state and local government is concerned, there has been a net loss of more than 150,000.
Has the $812 billion stimulus benefitted jobs? A simple calculation shows that the 593,000 private sector jobs, plus the Administration's claim of 600,000 jobs saved, means a total of 1.2 million jobs since the stimulus was passed. This many jobs divided into $812 billion yields a cost per job of more than $600,000 each—which, of course, is ridiculous and which means that the stimulus went somewhere, but not to new job creation.
As of late September 2010, there are approximately 27 million jobless in the U.S., when defined by the U-6 rate and adjusting for those groups chronically underestimated by the labor department's survey approach to estimating the unemployed among inner city youth, itinerant workers, and the 11 million undocumented in the labor force. That's a true unemployment rate between 17.5 and 18 percent. Additionally, more than one out of every three workers in the labor force experienced some period of unemployment during this recession.
Do Tax Cuts Really Create Jobs?
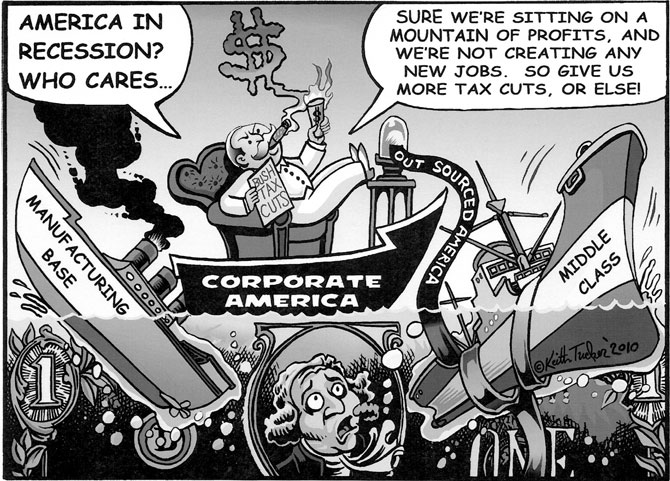
As the November elections campaign season intensified, the battle over extending the Bush tax cuts grew as well. Led by business interests and their friends in Congress, this took the initial form of calls to cut the federal deficit, that had risen to more than $11 trillion. But behind the deficit hawks' calls for spending cuts lies the real objective: take the heat off of ending the Bush tax cuts passed in 2001-04—that is continue the tax cuts for corporations and the wealthiest households—by cutting spending instead of allowing their tax cuts to expire.
Beginning with Reagan, tax cuts for corporations and wealthy investors have been the economic mantra of Republicans and conservatives and most Democrats as well. The idea that tax cuts create jobs has permeated the press and even public consciousness. What they mean more precisely, however, is that tax cuts for corporations and wealthy will create jobs.
But what, in fact, is the record of this myth? First, Bush pushed through a series of tax cuts between 2001-04 that amounted to a total of $3.4 trillion over the decade. Every tax cut bill for the rich was called a jobs creation bill. More than 80 percent of the $3.4 trillion accrued to the top 20 percent of households and corporations, and most of that to the top 5 percent and 1 percent. What did it produce in terms of jobs?
Between 2001 and 2004 the U.S. economy witnessed the weakest jobs creation on record. It took a full 48 months just to recover to the level of jobs in the economy that existed in January 2001 when the recession of that time began. It was a moderate recession, not like the present, yet it took four years to get back to a previous jobs level. Most of those jobs created, moreover, were likely due to the boom in the construction industry that had little to do with the tax cuts and more with the record-low 1 percent interest rates of the time.
Another test of the (business) tax cuts create jobs thesis is what happened in the spring of 2008. Bush and Congress passed a $168 billion stimulus bill; $90 billion of that was tax cuts and much of that was business tax cuts. What jobs did it create? Job losses and unemployment continued into the fall of 2008 when the bottom fell out of the job market and jobs began disappearing at a rate of nearly one million a month. So much for the second proof that tax cuts create jobs.
The Obama stimulus bill is yet another example of the failure of this idea. Of the original $787 billion stimulus passed in February 2009, about half was tax cuts. Approximately $225 billion was business and investor tax cuts. For that $225 billion we have 18 months later a total of 593,000 jobs, half of which are temps.
What those who advocate tax cuts for jobs refuse to acknowledge is that no business is going to invest and expand after a tax cut, or hire more employees, if there is no demand for the increased products produced by those added employees. If there is no additional consumption forthcoming, business will just pocket the tax cut savings; or invest it offshore where there is demand, as in China or Brazil; or use it to speculate in foreign exchange or other such markets to turn a nice short-term capital gain. But a consumption increase is not possible with 25 million unemployed; or with 10 million homes in foreclosure; or another 10 million under water in terms of net equity; or with households savings having been depleted, retirement funds having fallen by trillions, and so on. Tax cuts simply won't create jobs in that environment. Nevertheless, the same tired song is being sung yet again.
Sadly, the Obama administration has begun to sing it as well. In the past few months, for example, it has:
-
accelerated equipment depreciation write-offs (a form of business tax cut)
-
indicated its interest in considering a business payroll tax holiday
-
abandoned its promise to close loopholes and tax corporate foreign profits
-
gave up its proposal to make banks pay a tax to cover future bailouts
-
signaled it is willing to negotiate a reduction in the corporate tax rate for corporations sheltering profits in offshore subsidiaries
-
will eventually (this writer predicts) significantly soften—if not drop—its proposal to return the wealthiest 2 percent to pre-Bush level taxes (i.e., discontinue their Bush-era tax cuts)
Dimensions Of The Housing Crisis
The second horn on which the Obama administration has impaled itself is housing; specifically, residential housing and commercial construction.
 When the crisis in subprime housing loans imploded in August 2007, driving the rest of the financial system down, the Bush administration did nothing. It stalled by encouraging banks and mortgage lenders to introduce voluntary mortgage modifications. Nothing happened. When Obama took office, as part of his overall banking rescue plan, a mere $75 billion was committed to the housing crisis. This targeted the bailout of lenders by providing them subsidies if they lowered their mortgage rates to new buyers through what was called the Housing Affordability Modification Program (HAMP). HAMP did virtually nothing for those in foreclosure or delinquent on payments. Its target was not those in trouble, but to help new buyers get into the foreclosed homes or to subsidize home builders to help them sell their unsold inventory to new buyers.
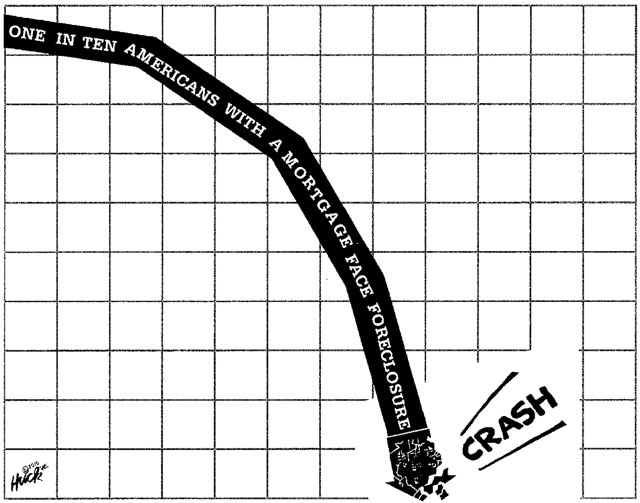
Delinquencies and foreclosures rose throughout 2009. The foreclosure rate grew from 2 percent of mortgages when the recession began in late December 2007 to 4.6 percent by December 2009.
In July 2009, there were 8 million (out of the 54 million total mortgages in the U.S.) who were behind in payments or in foreclosure, for a 13.5 percent rate. By July 2010 this had risen to 14.4 percent. The foreclosure rate has risen throughout 2010. It nearly doubled in 19 states, according to the industry source Realty Trac. It tripled in seven more states.
In July 2010 alone there were 325,000 defaults, a 4 percent increase in a month. Lenders seized 92,858 homes in July, the highest on record. This acceleration of foreclosure activity by banks and lenders was too much to tolerate in an election year. The Administration and courts responded by late summer 2010, identifying bank practices involving foreclosure processing that were highly questionable. Some banks and lenders, in response, suspended some foreclosure activity. It remains to be seen if this is temporary, designed not to create an embarrassing a situation in an the run-up to the November 2010 elections
The First Time Home Buyers Program did slow the fall in home prices as home prices stabilized in December 2009. They then remained flat throughout 2010 to September. The program was discontinued in the late spring of 2010. The consequence was a renewed collapse of home sales, a rise in the supply of unsold homes, and a likely near future fall in home prices once again.
July 2010 recorded the biggest drop in home sales on record, down 32 percent over the year earlier, already a weak amount. August 2010 recorded the lowest home sales since 1997. The supply of homes on the market has doubled from a 6.5 month supply in December 2009 to 12 months in August 2010. It is therefore clear that nothing has really been done concerning residential housing.
In terms of the commercial property markets (office buildings, hotels, resorts, industrial building, etc), there never was even a temporary halt to the decline. Commercial property prices have continued to fall over the past year by 7.3 percent, with July 2010 suffering the biggest one month fall of 10.9 percent.
To sum up, the administration's strategy and policies to address the construction sector, residential and commercial, has been abysmal. Like jobs, it has been too little too late. The picture is one of continued decline, and a decline that shows signs of accelerating.
The Rest Of The Economy
Jobs and housing are, of course, not the entire picture of the economy. But their failure to recover is sufficient to prevent the rest of the economy from recovering, and thus ensure continued general stagnation long term. Other elements of the economy include what's happening, for example, with manufacturing, the service sector, retail sales, business spending, consumption and household spending, and that aggregate indicator of all the above: gross domestic product or GDP. A look at these show a similar pattern in the first two years of the Obama administration. That pattern is an initial stemming of the rapid collapse of the economy, followed by a partial recovery of less than half of the initial decline, in turn followed by an extended stagnation period in which some sectors of the economy weaken and relapse once again.
Services constitute 78 percent of the economy and manufacturing another 10 percent. The above pattern is evident in both cases. The index representing the service sector of the economy collapsed after August 2008 with the banking panic of September-October 2008. It fell from a level of 50, which represented no growth, to a low of 38 representing a deep contraction. It recovered slowly in 2009 back to 50 and a high of 55 in May 2010. Since then it has fallen again, however, indicating a relapse is underway. The same trajectory is evident for manufacturing, falling from 50 to a low of 32, back to a high in April 2010 and since then a decline once more.
Business spending is another major part of the economy. Normally business spending varies annually from an increase of 6 to 9 percent annually and never fell below 3 percent even in recessions. In 2008, it grew by only 1.5 percent, then fell to an unprecedented minus 18 percent in 2009, the first such negative drop since 1945. Since then it has recovered only 3 percent of that decline. The current 3 percent recovery further compares to business spending increases of 9-10 percent, 30 months after the start of the recessions in the 1970s and early 1980s.
The pattern is repeated with retail sales. After dropping 10 percent, it grew back 3.6 percent between August 2009 and August 2010. After rising in the early months of 2010, it has leveled off and remained stagnant. In comparison to previous recessions, it has only recovered half of its decline, or 5 percent, whereas in recessions in the 1970s and 1980s, retail sales had recovered by 20-22 percent after 30 months from the start of the recession.
The same story is repeated for consumer or household spending, which fell to minus 1.2 percent in 2009, the worst drop since 1942. It recovered in 2009 due, in part, to the stimulus and the supplemental programs of cash for clunkers auto sales subsidization and First Time Home Buyers sales subsidization by the federal government. Consumer price cutting and states introduction of sales tax free holidays have kept household spending from falling further once again. But full recovery has not occurred with consumer spending essentially flat for the last several months. The picture is similar throughout the economy. What we see is a prevention of further collapse, a recovery of part of the losses, and a leveling out of the economy on all fronts—except for jobs and housing which continue to decline.
But all those factors weakened further by late summer 2010. Inventories have been restored as much as they will be. The Obama stimulus, as weak as it was, is dissipating, having run its course. Exports and manufacturing are weakening, as China purposely slows its economy and European countries gain the U.S.'s share of exports due to the falling euro. Consumer spending in the U.S. is going nowhere. State and local government spending is falling and housing is relapsing. Longer term, the prospect of cutting federal spending to address deficits, instead of raising the wealthy's taxes, looms large as a further problem for recovery in 2011.
Cognizant of this, some of the more prescient Democratic members of Congress have lately been rushing to shore up the cracks in the economic edifice. Obama has recently proposed a $30 billion small business lending bill, but the bill is designed primarily to subsidize smaller, regional banks to entice them to loan to small business since the larger banks refuse to do so. Nothing near the (insufficient) $30 billion will get to the businesses that need it. Obama has also announced a $50 billion infrastructure spending bill and Congress passed an additional $26 billion funding for states, local governments, and schools. All well and good. But one wonders if this was just pre-election posturing, proposals to be used as campaign material, knowing they won't pass Congress.
Historical Parallels
There are several interesting historical parallels to the situation today. The situation is not primarily similar to 1937, as Paul Krugman and other liberal economists argue that we are about to repeat the error of 1937, when fiscal spending was cut as a consequence of conservatives in the Senate and among business interests focusing on the need to reduce the deficit. And it certainly is not 1993-94, as conservatives and Republicans like to remind us, hoping to repeat the Contract for America conservative takeover from a Democratic president (Clinton). It is more similar to 1933-34.
 In 1933, Roosevelt bailed out the banks, the financial system was stabilized. Jobs were not the primary focus, except for getting a couple hundred thousand young men off the streets and into the forests as a result of the Civilian Conservation Corps. As a result of bailing out the banks the economy temporarily surged for the next six to nine months as industrial production nearly doubled, prices rose, and businesses expanded inventories sharply in anticipation of higher prices and sales. After falling 89 percent, the stock market boomed back 60 percent of that loss. But it was temporary. By year end 1933 it all flattened out. The economy moved sideways in 1934. Facing midterm elections in 1934, Roosevelt and his advisors announced a more aggressive program of vast fiscal spending and job creation, including the Works Progress Administration. That fiscal stimulus resulted in a significant recovery of the economy in 1935-37. But that stimulus was stopped in its tracks in 1937-38 by conservatives, led by the Senate. The New Deal was reduced and the economy immediately fell back into depression in 1938. It never got out of depression, with unemployment at 15 percent levels well into 1941. It wasn't until 1942, with increased government spending to 40 percent of the economy, from the New Deal period of 17 percent, that a sustained recovery of the economy began.
This is the fall of 1934 once again. Obama's historical legacy will not be FDR, but more likely a repeat of Carter in 1978, another president who inherited a mess made by Republicans in the 1970s, but who, for whatever reasons, couldn't or wouldn't take advantage of the historic opportunity. The eventual result we all know: Ronald Reagan and three subsequent decades of declining living standards for 80 percent of households, consumers, and workers in America—and the implementation of policies eventually leading to the current crisis.
Z
Jack Rasmus is the author of Epic Recession: Prelude To Global Depression (Palgrave-Macmillan and Pluto Press).