The starting point for Venezuela’s current depression has been the subject of some debate. It can get a bit technical, so I’ll weigh in on it here.
Looking at Real GDP
Inflation adjusted (i.e. real) Gross Domestic Product (GDP ) is essentially a country’s aggregate income. I say “essentially” because there is an adjustment that should be made for the depreciation of capital goods. Hence the word “Gross” in Gross Domestic Product. When the adjustment is made to GDP it yields Net National Income – the total of all wages, salaries and rent paid out to everybody in an economy in the current year. For the entire OECD, the difference between Net National Income and GDP was about 20% in 2016. However, GDP is the most commonly cited measure.
If we look at the average annual value of real GDP in Venezuela since 2012, it is clear that economic growth turned negative in 2014 and got progressively worse in the following years. By 2016, calling the recession a depression would be appropriate.

However, one definition of a recession is two consecutive quarters in which quarterly real GDP gets smaller.
I used the statistical program Gretl to seasonally adjust Venezuela’s quarterly real GDP from 1999 (the first year Chavez was in office) until the third quarter of 2018 (the last quarter for which the Central Bank had released data). Note that the Central Bank data is considered accurate by opposition economist Francisco Rodriguez though he has criticized the government for withholding data.[1]
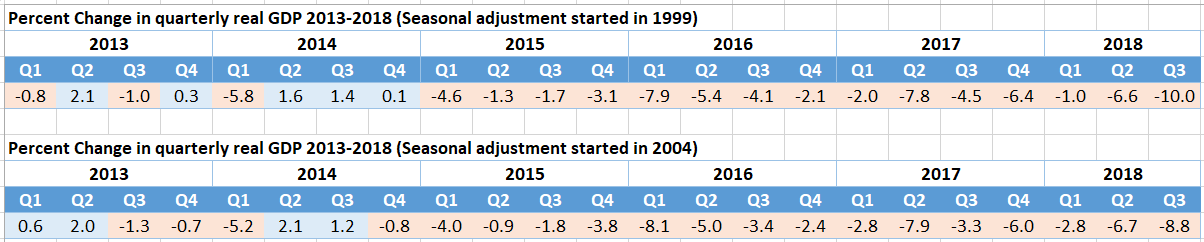
Quarters with negative growth are shaded pink in the tables above.
If data is seasonally adjusted starting in 1999 then consecutive quarters of negative growth did not happen until the beginning of 2015, by which point the oil prices on which Venezuela depends had dropped by about half. If the data is seasonally adjusted starting in 2004 then a brief recession took place in 2013 followed by recovery in 2014 (notably after the violent protests of 2014 ended). The recovery then ended with the collapse in oil prices late in 2014 and continuing (and getting worse) in subsequent periods.
The numerous shocks to Venezuela’s economy since 1999 – six coup attempts, drastic changes in oil prices, and US sanctions – skew seasonality adjustments. I see no objective basis for deciding which of the adjustments above is more appropriate. However, in both we see that Venezuela’s current, and ongoing, downward spiral coincides with the collapse in oil prices at the end of 2014.[2] During the last quarter of 2014 alone, crude oil prices collapsed by almost half. The collapsed was also sustained for far longer than credible analysts predicted.
Crude Oil Prices: Oct – Dec 2014

[1] On July 29, 2019 Rodriguez wrote “…there is as of yet little indication that the Nicolás Maduro administration has tampered with the data that it has published.“ Report entitled “VENEZUELA EXPORTS PLUNGE TO NEW LOW”. In fact, in the same report he wrote the Central Bank released in May of 2019 “ confirms our view that the seven-digit price increases reported by the [opposition-controlled] National Assembly were improbably high”
[2] Oil price data was taken from the Trading Economies site.
ZNetwork is funded solely through the generosity of its readers.
Donate