It seems to me that many people who consider themselves left wing are unaware of the polling data on Medicare for All. On the one the hand we have the Democratic establishment crowd, who typically assume that, because Democratic leaders largely oppose Medicare for All, public opinion must be against it as well. (About four of one hundred favor it in the Senate.) On the other hand we have the Medicare for All activist crowd, who sometimes believe support is higher than it really is. (For example, a two thirds majority hasn’t been recorded in any poll this year.)
To explain the situation, I did the following exercise. I took all the polls I could find from this year on Medicare for All, along with a roughly equal number of polls on the "public option," and plotted them on this graph:

There are four bands in this picture. The first two bands, one black and one red, represent Medicare for All support and opposition. In any poll, we will have a certain number in support, a certain number opposed, and some undecideds. The next two bands represent support and opposition to the public option. The blue dots represent the mean of the closest band. The mean for the first band indicates that a very narrow majority (50.4%) is in support of Medicare for All and a slightly larger majority supports the public option.
The Medicare for All polls I used are listed here. Most are available through this link. I also made sure to use the one commented on by Matthew Yglesias here.
Kaiser Tracking Poll (Phrasing #1, yearly average) 46.8-49%
Kaiser Tracking Poll (Phrasing #2) 58-38%
CBS/NYT Poll (covering only emergency problems) 59-32%
CBS/NYT Poll (covering all medical problems) 49-42%
Grove Opinion Research Corp. Poll 59-?%
Time Magazine Poll 49-46%
Rasmussen Poll 32-57%
The public option polls I used were:
Rasmussen Poll 41-41%
Kaiser Tracking Poll 65-29%
Economist/YouGov Poll 41-33%
CBS/NYT Poll 72-20%
Quinnipiac Poll 62-32%
Time/SRBI 56-36%
Choosing public option polls required some thought because there are so many. I adhered to the following guideline: either use Nate Silver’s recommended polls or choose one from the same source as a Medicare for All poll. (All the polls above are also linked to by Silver’s page.)
At this point I thought it would be helpful to try to get rid of polls that might not be valid and look at the results. Therefore, I removed both polls by Rasmussen because the way they’re phrased seems biased. I also removed the NYT/CBS figure asking about coverage of emergency problems only, since Medicare for All would cover more than that. (Of course, one could argue that the other figure for all medical problems is bad too, since Medicare doesn’t cover all medical problems. Ideally, we might perhaps then use a weighted average, but I did not bother.) Finally, I threw out the CBS/NYT public option poll because it calls the public option a plan like Medicare, which it is not.
Here are the results.

Medicare for All support increases a bit to 52.4% and opposition correspondingly goes down.
My own personal view is that because many polls finding lower numbers on Medicare for All use only the description "single payer," even the 52.4% result is probably low. People do not know what the public option means, so it’s fair to assume they also don’t know what single payer means. The data also stands on its head the conventional wisdom of the media, namely that people favor abstract ideas over concrete proposals. In this case, they favor the concrete proposal of Medicare for All more than the abstract concept of single payer (not that the concept is necessarily understood). And on the public option polls, it’s also worth noting that none of these have the slightest bearing on what is actually being proposed in Congressional bills right now in the House and Senate, since those public options are not available to 90% of the public.
Finally, to show where political leaders are on this issue, I made the following fun graphic. (But it’s actually a little biased against Medicare for All, since it places all the undecideds in opposition.)
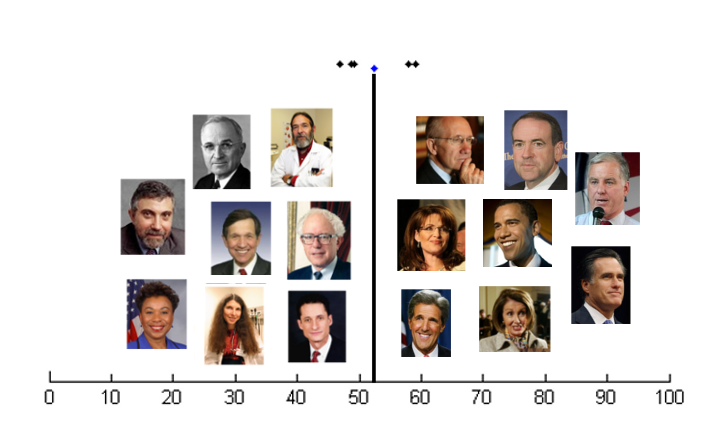
On the right side, we have leading political figures from both the Democratic and Republican Party. On the left side, we have an assortment of underdogs: a few select members of Congress, two founders of Physicians for a National Health Program, one Nobel Prize winner, and the one US President to ever make a serious attempt at instituting national health insurance in this country. I include these folks because it’s really worth emphasizing that there are plenty of Medicare for All supporters to choose from, even though they’re not currently setting the agenda. For those who favor national health insurance, these are the people, not those on the right side, who should be listened to.
ZNetwork is funded solely through the generosity of its readers.
Donate